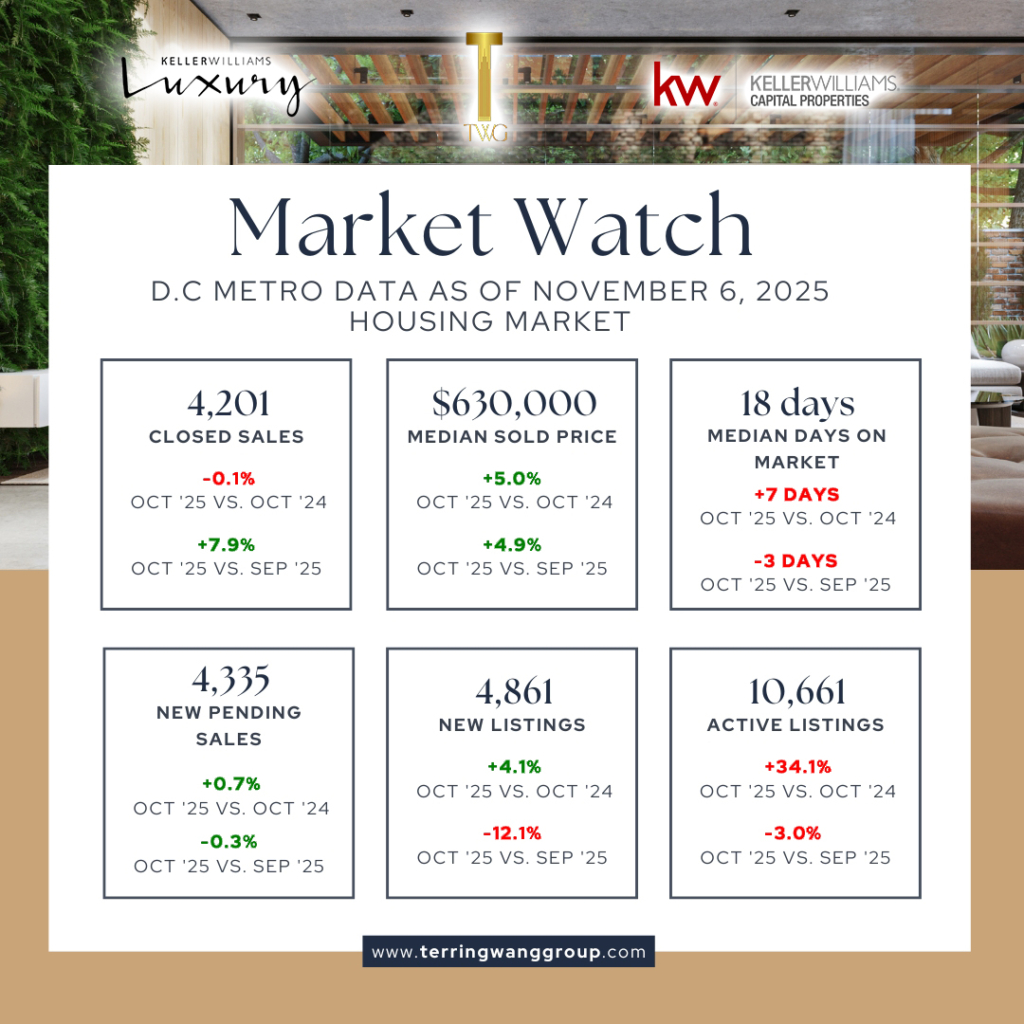
Market Update

Market Watch – Week Ending December 15, 2024

https://terringwanggroup.com/wp-content/uploads/2024/12/Dec-15-Market-Watch.mp4The Washington, DC real estate market showed mixed results during the week ending December 15, 2024. Below is an overview of the key performance metrics: New Listings: A total of 628 new listings were recorded, reflecting a 5.2% increase compared to the same week in December 2023. However, new listings saw a notable decline...

Market Update – November 2024

As of November 2024, closed sales in the Washington, D.C. metro area have shown notable improvement, with a 7.7% increase compared to November 2023. This growth has helped shift the year-to-date sales trend into positive territory, up by 0.5%. The outlook for the market remains optimistic, bolstered by strong performance in new pending sales, which saw a significant 13.8% year-over-year...

Market Watch – Week Ending December 8, 2024

https://terringwanggroup.com/wp-content/uploads/2024/12/Dec-8-Market-Watch.mp4 As we approach the end of the year, the real estate market in the DC Metro area is showing continued signs of activity, with key indicators revealing mixed trends as buyers and sellers adjust to current conditions. New Listings: The number of new listings in the DC Metro area reached 836 this week, representing a 12.8%...

Market Watch – Week Ending December 1, 2024

https://terringwanggroup.com/wp-content/uploads/2024/12/Dec-1-Market-Watch.mp4 As we approach the final weeks of 2024, the DC Metro real estate market continues to show signs of seasonal slowdown, with notable shifts in key metrics. The week ending December 1, 2024, presents a mixed picture for homebuyers and sellers alike, with decreases in new listings and purchase contracts, while median list prices...

Market Watch – Week Ending November 17, 2024

https://terringwanggroup.com/wp-content/uploads/2024/11/NOV17-Market-Watch.mp4The Washington DC real estate market for the week ending November 17, 2024, shows steady activity with mixed trends. Buyer interest remains strong, as evidenced by a 26.3% increase in showings year-over-year and a 14.4% rise from the previous week. However, new purchase contracts have slightly slowed down, down 2.3% from the...

Market Watch – Week Ending November 3, 2024

https://terringwanggroup.com/wp-content/uploads/2024/11/NOV3-Market-Update.mp4 For the week ending November 3, the Mid-Atlantic region saw 5,462 new contracts, reflecting a 5.6% decrease compared to the previous week. Despite this decline, the number of pending contracts remains 3.9% higher than the same period last year, marking the ninth consecutive week of year-over-year increases. This indicates...

Commercial Market Update – 3rd Quarter 2024

https://terringwanggroup.com/wp-content/uploads/2024/10/Commercial-Market-Update-web.mp4 The Washington region enjoys one of the highest median incomes in the nation, supporting a robust consumer base. The retail market remains tight, with an availability rate of 4.3%, the lowest since 2008, and annual asking rent growth at 3.6%, surpassing the 10-year average of 2.7%. However, due to a lack of new...

Market Watch – Week Ending October 27, 2024

https://terringwanggroup.com/wp-content/uploads/2024/10/Market-Update-27Oct-1.mp4For the week ending October 27, the Mid-Atlantic region saw 5,783 new contracts. With improved affordability this fall, new contracts are up 13.2% compared to the same week in 2023, and are noticeably higher than levels from 2022 as well.There has been a substantial increase in showings for the second consecutive week,...

Market Watch – Week Ending October 13, 2024

DC Metro had a median list price of $419,990 for the week ending October 13. The fall season usually sees consecutive declines as the market cools for the year, but there was a 2.1% increase from last week, bumping list prices 6.6% higher than the same week in 2023. Many buyers have returned to the market, keeping prices elevated for longer. There were 5,835 new purchase contracts in the...

Market Watch – Week Ending October 6, 2024

For the week ending October 6, the median list price in the Bright MLS service area was $410,450, marking a 1.1% decline and continuing a trend of decreases for the fourth consecutive week. This drop is typical as we transition further into fall. However, despite this seasonal trend, the current median list price remains 2.9% higher than it was during the same...

Compare listings

Compare
Search
Price Range From To
Other Features